Understanding Wick Fills in Crypto Trading: How to Use Them for Profitable Trades
When analyzing candlestick charts, traders often focus on wicks (also known as shadows) as key indicators of potential price movement. In this post, we’ll explore what wicks are, what it means when a wick is “filled,” and how you can incorporate wick fills into your crypto trading strategy.
What Are Wicks in Candlestick Charts?
A candlestick represents price movement over a specific time frame. The body of the candlestick shows the opening and closing prices, while the wicks (the thin lines extending above and below the body) represent the highest and lowest prices during that period.
- Upper wick: The price reached a high during the period but was pushed back down before closing.
- Lower wick: The price dropped to a low during the period but recovered before the candle closed.
Wicks often indicate areas of price rejection where buyers or sellers stepped in aggressively, causing the price to reverse direction.
What Does “Filling the Wick” Mean?
When traders talk about filling the wick, they mean that price action revisits the range covered by the wick from a previous candlestick. For example, if there was a long upper wick on a candle, filling the wick would mean that price moves back up to the high of that wick.
This concept is based on the idea that markets often seek to balance areas where price moved rapidly without much trading volume. Wicks can represent areas of liquidity gaps or imbalances that the market may want to “retest” before continuing in its trend.
Why Do Wicks Get Filled?
- Liquidity Zones: Wicks often form in areas where there is a large concentration of buy or sell orders. When price revisits these areas, it may fill remaining liquidity before continuing in the original direction.
- Support and Resistance: Long wicks can mark key support or resistance levels. If price revisits these levels, it may either bounce or break through, depending on the strength of the trend.
- Price Imbalance: Wicks can occur when price moves too quickly in one direction, leaving an imbalance where not enough trading occurred. The market often returns to these areas to “fill” the imbalance before proceeding.
How to Trade Wick Fills Effectively
Trading wick fills can be a profitable strategy if you understand how to identify them and manage your risk properly. Here’s how:
1. Identify Key Wicks on the Chart
Look for candlesticks with long wicks, especially those that form near significant support or resistance levels. Wicks that occur after a sharp price movement are more likely to be revisited.
2. Wait for Confirmation
Before entering a trade, wait for confirmation that the wick is being filled. This can be done by observing:
- A candle closing within the wick’s range.
- A reversal signal, such as a bullish engulfing candle after a long lower wick.
- Indicators such as RSI or Bollinger Bands showing oversold or overbought conditions.
3. Set Entry and Exit Points
- Entry: Enter the trade once the price starts to fill the wick and shows signs of continuation.
- Take-Profit: Consider taking profit at key levels, such as the high or low of the wick.
- Stop-Loss: Set a stop-loss below the wick (for long trades) or above the wick (for short trades) to limit your risk.
Example of a Wick Fill Trade
Imagine you are trading on a 15-minute chart, and you notice a long lower wick that touched a key support level before price rebounded. This wick indicates that sellers briefly pushed the price down, but buyers quickly stepped in and drove it back up, rejecting lower prices.
You decide to enter a long position once price revisits the wick and shows signs of reversal (e.g., a bullish candle forming near the wick’s low). You set your take-profit target near the high of the wick and place a stop-loss just below the wick’s low to manage your risk.
This approach allows you to capitalize on the likelihood that the market will retest and fill the wick before continuing in its original direction.
Using Indicators to Confirm Wick Fills
Indicators can help improve your accuracy when trading wick fills:
- Bollinger Bands: If a wick touches or moves outside the lower or upper band, it may signal that the price is oversold or overbought, increasing the chances of a reversal.
- RSI (Relative Strength Index): An RSI near 30 or 70 can confirm oversold or overbought conditions, respectively.
- Volume: A wick followed by high trading volume can indicate strong interest at that level, making it more likely that the price will revisit or bounce from the wick.
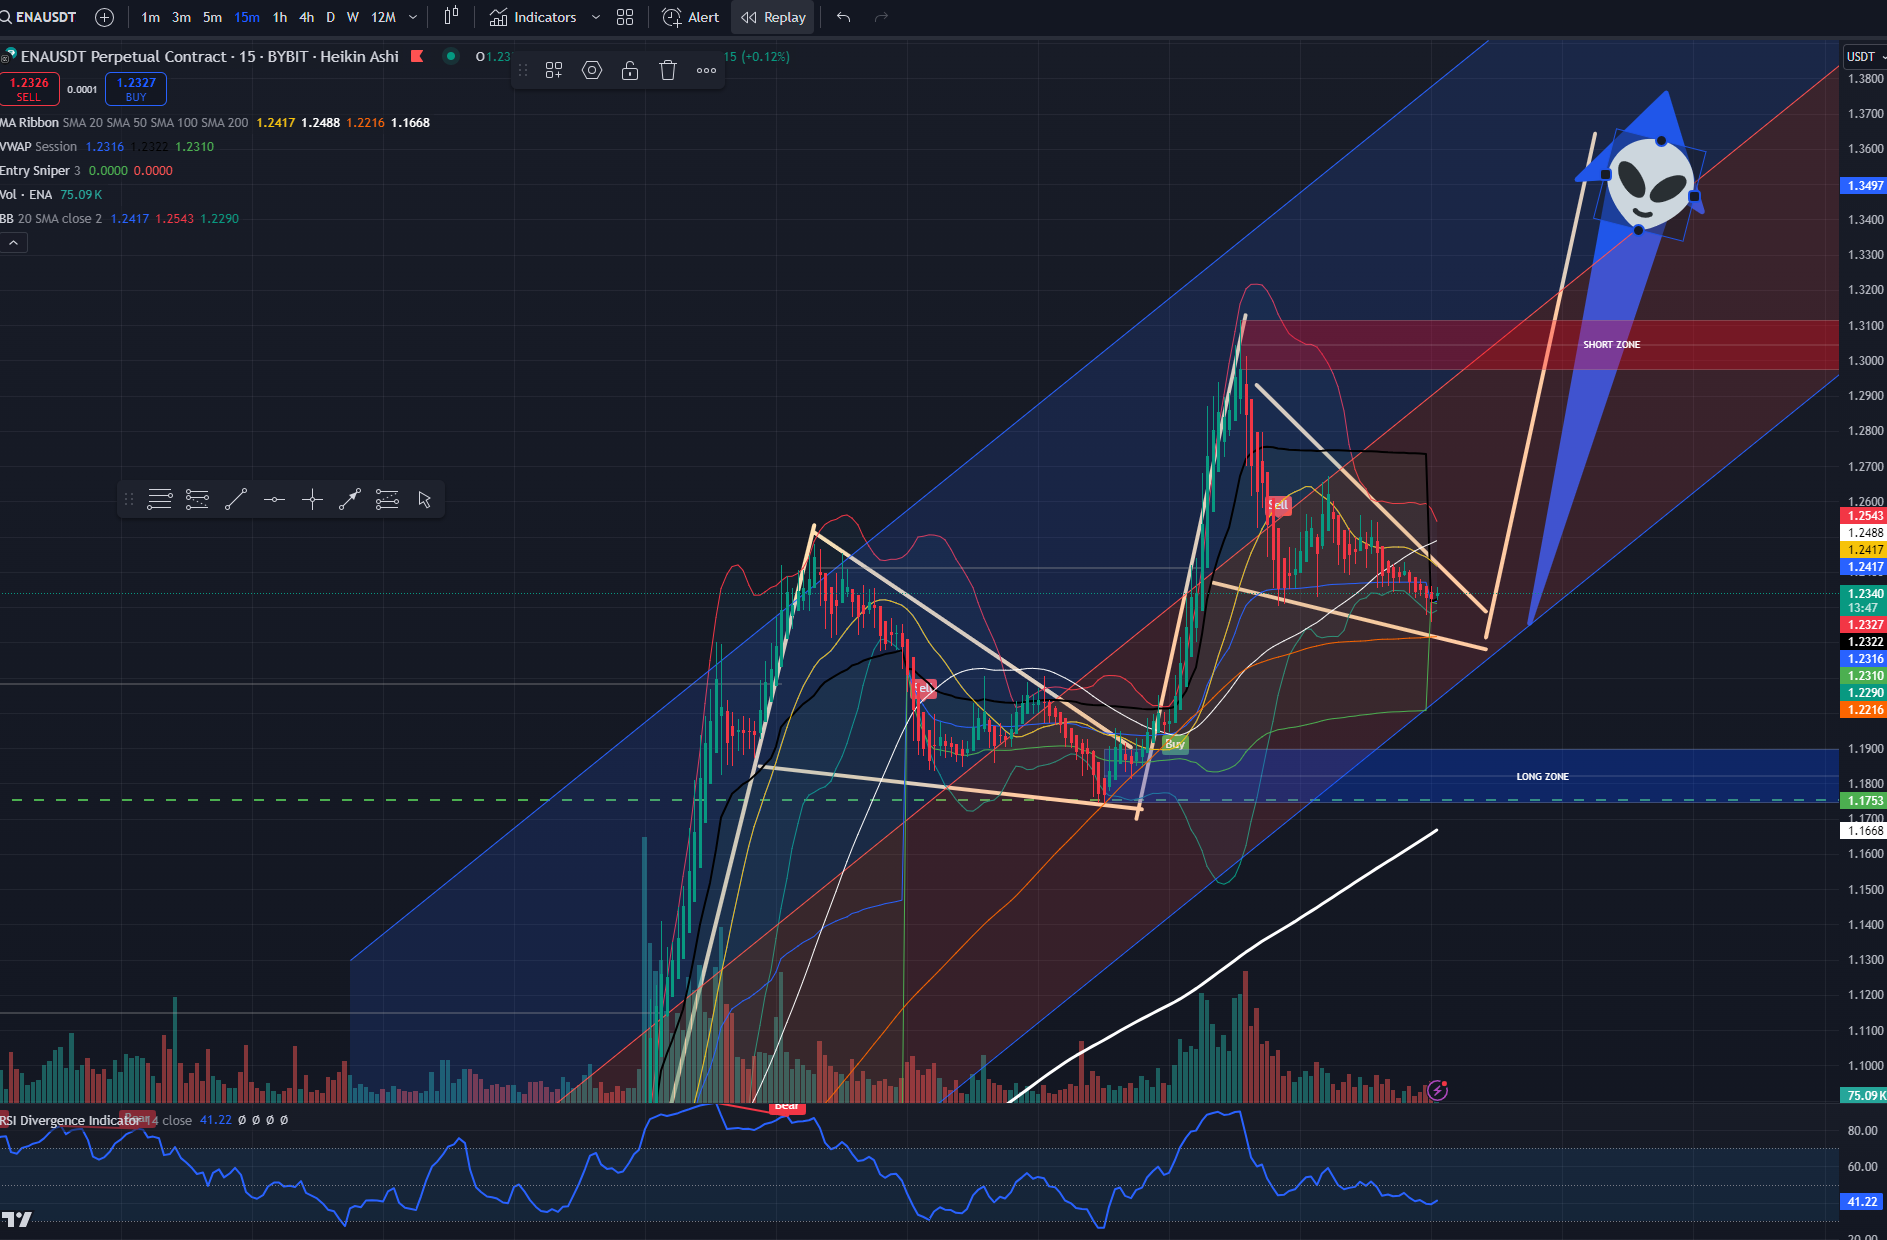
Real-World Example: Annotated Chart Analysis
Below is an annotated chart showing a real-world example of a potential bull flag pattern forming alongside wick fills:

In this chart, we observe the following:
- Flagpole Formation: A sharp upward move, forming the initial flagpole.
- Consolidation Phase: The price consolidates in a downward-sloping channel, forming the flag.
- Wick Fills: Multiple long lower wicks touch key support zones, indicating strong buying pressure at lower levels.
- RSI Divergence: RSI shows a bullish divergence, further supporting a potential upward breakout.
- Breakout Expectation: Traders would anticipate a breakout above the upper boundary of the flag, with potential targets near the previous high.
Final Thoughts
Wicks on candlestick charts are more than just visual elements; they represent critical price levels that can offer trading opportunities. By understanding how and why wicks get filled, you can improve your trading strategy and increase your chances of success.
Remember, while wick fills can be a powerful tool, they are not foolproof. Always use proper risk management, such as setting stop-losses and taking partial profits, especially when trading with leverage.
Would you like more tips on trading strategies or chart analysis? Stay tuned for more in-depth posts!


Leave a Reply